The emotion analytics explicit person's verbal and non-verbal communications to understand the mood and attitude. In the connected world, people are inclined to express emotions, sentiments, and feelings via text/comments, emojis, likes, and dislikes.
With the increase in the adoption of advance machine learning technologies many industry verticals are using & analyzing the human behavior across different industries such as enterprises, defense and aerospace, commercial, industrial among others. Biometrics is one of the technologies that is being vastly implemented by various organizations to secure their business operations. The emotion analytics data is used by the companies to create strategies that will improve their business, data collection, data classification, data analytics, and data visualization. Also, to identify customer's perception towards their products & services.
The emotion analytics market is expected to grow at a CAGR of 80% during the forecast period 2017–2023. The emotion analytics market is driven by huge adoption of API & SDK applications due to the growing demand for providing effective options for customers based on emotion based applications.
The major players included in this report are Microsoft, IBM, Retinad Virtual Reality, Neuromore, Imotions, Kairos, Beyond Verbal, Affectiva, Eyris and others.
This report offers major trends, industry trends which is going to play a major role in emotion analytics market during the forecasted year. Moreover, this report can also tailored as per the requirement by the users, and also available with deeper segmentation by regions, countries, and vendor profiling.
1. Introduction
1.1. Goal & Objective
1.2. Report Coverage
1.3. Supply Side Data Modelling & Methodology
1.4. Demand Side Data Modelling & Methodology
2. Executive Summary
3. Market Outlook
3.1. Introduction
3.2. Current & Future Outlook
3.3. DROC
3.3.1. Drivers
3.3.2. Restraints
3.3.3. Opportunities
3.3.4. Challenges
4. Emotion Analytics Market, By Technology
4.1. Introduction
4.2. Biometrics
4.3. Artificial Intelligence
4.4. Pattern Recognition
4.5. 3D Modelling
4.6. Others
5. Emotion Analytics Market, By End-User
5.1. Introduction
5.2. Media & Entertainment
5.3. Retail
5.4. Healthcare
5.5. Financial Services
5.6. Others
6. Emotion Analytics Market Analysis, By Region
6.1. North America
6.1.1. U.S.A
6.1.2. Canada
6.1.3. Mexico
6.2. Asia-Pacific
6.2.1. India
6.2.2. Japan
6.2.3. China
6.2.4. South Korea
6.2.5. Australia
6.2.6. Others
6.3. Europe
6.3.1. Germany
6.3.2. UK
6.3.3. Sweden
6.3.4. France
6.3.5. Italy
6.3.6. Others
6.4. Middle East & Africa
6.4.1. Saudi Arabia
6.4.2. UAE
6.4.3. Others
6.5. South America
6.5.1. Brazil
6.5.2. Others
7. Supply Market Analysis
7.1. Strategic Benchmarking
7.2. Market Share Analysis
7.3. Key Players
7.3.1. Microsoft
7.3.2. IBM
7.3.3. Retinad Virtual Reality
7.3.4. Neuromore
7.3.5. Imotions
7.3.6. Kairos
7.3.7. Beyond Verbal
7.3.8. Affectiva
7.3.9. Eyris and others
SDMR employs a three way data triangulation approach to arrive at market estimates. We use primary research, secondary research and data triangulation by top down and bottom up approach
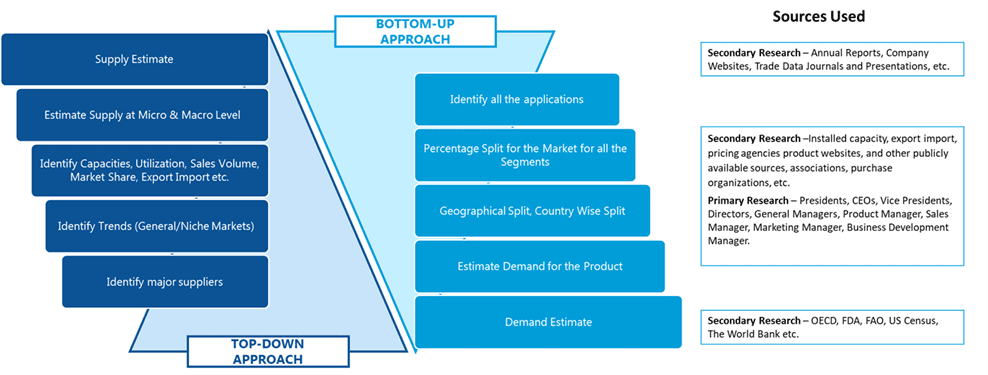
Secondary Research:
Our research methodology involves in-depth desk research using various secondary sources. Data is gathered from association/government publications/databases, company websites, press releases, annual reports/presentations/sec filings, technical papers, journals, research papers, magazines, conferences, tradeshows, and blogs.
Key Data Points through secondary research-
Macro-economic data points
Import Export data
Identification of major market trends across various applications
Primary understanding of the industry for both the regions
Competitors analysis for the production capacities, key production sites, competitive landscape
Key customers
Production Capacity
Pricing Scenario
Cost Margin Analysis
Key Data Points through primary research-
Major factors driving the market and its end application markets
Comparative analysis and customer analysis
Regional presence
Collaborations or tie-ups
Annual Production, and sales
Profit Margins
Average Selling Price
Data Triangulation:
Data triangulation is done using top down and bottom approaches. However, to develop accurate market sizing estimations, both the methodologies are used to accurately arrive at the market size. Insert Image
