The global ceramic sanitary ware market was valued at $ 41 billion in 2018 and is expected to reach grow at a CAGR of 9.8% reach $ 60 billion by 2023. The factors favoring the market growth are increase in middle class income group, rising disposable, changing lifestyle, government initiatives for hygiene and sanitation in developing regions.
By technology, the ceramic sanitary ware market has been classified as slip casting, tape casting, pressure casting and others. Slip casting captured the largest share in 2017 as it offers slip casting will capture the largest share it has advantages such as that complex geometries is shaped easily, universal technology which fits in every design and every clay.
By type, the ceramic sanitary ware market has been classified into washbasins, water closets, cisterns, pedestal, bidets, and urinals. In 2017, wash basins captured the largest share as wash basin installation is essential in every residential and commercial construction.
In 2017, the market for ceramic sanitary ware market has been dominated by the Asia-Pacific region, followed by Europe and North America. Asia-Pacific captured the major market share of the worldwide market for ceramic sanitary ware in 2017 and is expected to continue to be the major market through 2023. In terms of countries, five countries, including China, India, Brazil, Egypt and Turkey will experience high growth in the ceramic sanitary ware market in 2017.
This market is driven by the considerable investments in ceramic sanitary ware for new production capacities in the emerging markets and also significant investments in modernization of production facilities in major producing countries. Companies have been focusing on launching new products in this market. Some of the major companies dominating the ceramic sanitaryware market include TOTO (Japan), American Standard, Grohe, and Roca Sanitario SA, Tangshan Huida Ceramics Group, Arrow Ceramics Co. Ltd, Foshan EAGO Sanitaryware Co. Ltd, and Chongqing Swell Ceramic Industry Group, Kohler Group, Roca Sanitario SA, Inax , Duravit AG, Kita-Kyushu, RAK Ceramics, Eczacibasi Holding Co., Ceramica Althea, Villeroy & Boch , and Sanitec , Duratex , Corona Group, Cisa Holdings, Ferrum S.A. De Ceramica Y Metalurgia, and Hervy Sanitary ware and Others.
1. Introduction
1.1. Goal & Objective
1.2. Report Coverage
1.3. Supply Side Data Modelling & Methodology
1.4. Demand Side Data Modelling & Methodology
2. Executive Summary
3. Market Outlook
3.1. Introduction
3.2. Current & Future Outlook
3.3. DROC
3.3.1. Drivers
3.3.1.1. Increasing per capita disposable income
3.3.1.2. Growth in construction sector
3.3.1.3. Government initiatives for hygiene and sanitation in developing regions.
3.3.2. Restraints
3.3.3. Opportunities
3.3.3.1. Home renovation projects
3.3.3.2. Growing construction projects in South East Asian region
3.4. Market Entry Matrix
3.5. Market Opportunity Analysis
3.6. Market Regulations
3.7. Pricing Mix
3.8. Key Customers
3.9. Value Chain & Ecosystem
4. Demand Market Analysis
4.1. Ceramic Sanitary Ware Market, By Technology
4.1.1. Slip casting
4.1.1.1. Market Size & Forecasts, 2018-2025
4.1.1.2. Slip casting, Tape casting, Pressure Casting
4.1.2. Tape casting
4.1.2.1. Market Size & Forecasts, 2018-2025
4.1.3. Pressure Casting
4.1.3.1. Market Size & Forecasts, 2018-2025
4.1.4. Others
4.1.4.1. Market Size & Forecasts, 2018-2025
5. Ceramic Sanitary Ware Market, By product Type
5.1. Introduction
5.2. Washbasins
5.2.1. Market Size & Forecasts, 2018-2025
5.3. Water closets
5.3.1. Market Size & Forecasts, 2018-2025
5.4. Cisterns
5.4.1. Market Size & Forecasts, 2018-2025
5.5. Pedestal
5.5.1. Market Size & Forecasts, 2018-2025
5.6. Bidets
5.6.1. Market Size & Forecasts, 2018-2025
5.7. Urinals
5.7.1. Market Size & Forecasts, 2018-2025
5.8. Others
5.8.1. Market Size & Forecasts, 2018-2025
6. Ceramic Sanitary Ware Market, By Application
6.1. Introduction
6.2. Residential
6.2.1. Market Size By Region, 2018-2025
6.3. Commercial
6.3.1. Market Size By Region, 2018-2025
7. Ceramic Sanitary Ware Market Analysis, By Region
7.1. North America
7.1.1. North America Market Size, By Country 2018-2025
7.1.2. North America Market Size, By Type 2018-2025
7.1.3. North America Market Size, By Application 2018-2025
7.1.3.1. U.S.
7.1.3.1.1. U.S. Market Size, By Type 2018-2025
7.1.3.1.2. U.S. Market Size, By Application 2018-2025
7.1.3.2. Canada
7.1.3.2.1. Canada Market Size, By Type 2018-2025
7.1.3.2.2. Canada Market Size, By Application 2018-2025
7.1.3.3. Mexico
7.1.3.3.1. Mexico Market Size, By Type 2018-2025
7.1.3.3.2. Mexico Market Size, By Application 2018-2025
7.2. Europe
7.2.1. Europe Market Size, By Country 2018-2025
7.2.2. Europe Market Size, By Type 2018-2025
7.2.3. Europe Market Size, By Application 2018-2025
7.2.3.1. Germany
7.2.3.1.1. Germany Market Size, By Type 2018-2025
7.2.3.1.2. Germany Market Size, By Application 2018-2025
7.2.3.2. Italy
7.2.3.2.1. Italy Market Size, By Type 2018-2025
7.2.3.2.2. Italy Market Size, By Application 2018-2025
7.2.3.3. U.K.
7.2.3.3.1. U.K. Market Size, By Type 2018-2025
7.2.3.3.2. U.K. Market Size, By Application 2018-2025
7.2.3.4. France
7.2.3.4.1. France Market Size, By Type 2018-2025
7.2.3.4.2. France Market Size, By Application 2018-2025
7.2.3.5. Spain
7.2.3.5.1. Spain Market Size, By Type 2018-2025
7.2.3.5.2. Spain Market Size, By Application 2018-2025
7.2.3.6. Russia
7.2.3.6.1. Russia Market Size, By Type 2018-2025
7.2.3.6.2. Russia Market Size, By Application 2018-2025
7.2.3.7. Rest of Europe
7.2.3.7.1. Rest of Europe Market Size, By Type 2018-2025
7.2.3.7.2. Rest of Europe Market Size, By Application 2018-2025
7.3. Asia-Pacific
7.3.1. Asia-Pacific Market Size, By Country 2018-2025
7.3.2. Asia-Pacific Market Size, By Type 2018-2025
7.3.3. Asia-Pacific Market Size, By Application 2018-2025
7.3.3.1. China
7.3.3.1.1. China Market Size, By Type 2018-2025
7.3.3.1.2. China Market Size, By Application 2018-2025
7.3.3.2. Japan
7.3.3.2.1. Japan Market Size, By Type 2018-2025
7.3.3.2.2. Japan Market Size, By Application 2018-2025
7.3.3.3. India
7.3.3.3.1. India Market Size, By Type 2018-2025
7.3.3.3.2. India Market Size, By Application 2018-2025
7.3.3.4. South Korea
7.3.3.4.1. South Korea Market Size, By Type 2018-2025
7.3.3.4.2. South Korea Market Size, By Application 2018-2025
7.3.3.5. Taiwan
7.3.3.5.1. Taiwan Market Size, By Type 2018-2025
7.3.3.5.2. Taiwan Market Size, By Application 2018-2025
7.3.3.6. Thailand
7.3.3.6.1. Thailand Market Size, By Type 2018-2025
7.3.3.6.2. Thailand Market Size, By Application 2018-2025
7.3.3.7. Malaysia
7.3.3.7.1. Malaysia Market Size, By Type 2018-2025
7.3.3.7.2. Malaysia Market Size, By Application 2018-2025
7.3.3.8. Indonesia
7.3.3.8.1. Indonesia Market Size, By Type 2018-2025
7.3.3.8.2. Indonesia Market Size, By Application 2018-2025
7.3.3.9. Australia
7.3.3.9.1. Australia Market Size, By Type 2018-2025
7.3.3.9.2. Australia Market Size, By Application 2018-2025
7.3.3.10. Rest of Asia-Pacific
7.3.3.10.1. Rest of Asia-Pacific Market Size, By Type 2018-2025
7.3.3.10.2. Rest of Asia-Pacific Market Size, By Application 2018-2025
7.4. Middle East & Africa
7.4.1. Middle East & Africa Market Size, By Country 2018-2025
7.4.2. Middle East & Africa Market Size, By Type 2018-2025
7.4.2.1. Saudi Arabia
7.4.2.1.1. Saudi Arabia Market Size, By Type 2018-2025
7.4.2.1.2. Saudi Arabia Market Size, By Application 2018-2025
7.4.2.2. UAE
7.4.2.2.1. UAE Market Size, By Type 2018-2025
7.4.2.2.2. UAE Market Size, By Application 2018-2025
7.4.2.3. Turkey
7.4.2.3.1. Turkey Market Size, By Type 2018-2025
7.4.2.3.2. Turkey Market Size, By Application 2018-2025
7.4.2.4. Rest Of Middle East & Africa
7.4.2.4.1. Rest Of Middle East & Africa Market Size, By Type 2018-2025
7.4.2.4.2. Rest Of Middle East & Africa Market Size, By Application 2018-2025
7.5. South America
7.5.1. South America Market Size, By Country 2018-2025
7.5.2. South America Market Size, By Type 2018-2025
7.5.3. South America Market Size, By Application 2018-2025
7.5.3.1. Brazil
7.5.3.1.1. Brazil Market Size, By Type 2018-2025
7.5.3.1.2. Brazil Market Size, By Application 2018-2025
7.5.3.2. Argentina
7.5.3.2.1. Argentina Market Size, By Type 2018-2025
7.5.3.2.2. Argentina Market Size, By Application 2018-2025
7.5.3.3. Rest of South America
7.5.3.3.1. Rest of South America Market Size, By Type 2018-2025
7.5.3.3.2. Rest of South America Market Size, By Application 2018-2025
8. Supply Market Analysis
8.1. Strategic Benchmarking
8.2. Market Share Analysis
8.3. Key Players
8.3.1. TOTO (Japan)
8.3.2. American Standard
8.3.3. Grohe
8.3.4. Roca Sanitario SA
8.3.5. Tangshan Huida Ceramics Group
8.3.6. Arrow Ceramics Co. Ltd
8.3.7. Foshan EAGO Sanitaryware Co. Ltd
8.3.8. Chongqing Swell Ceramic Industry Group
8.3.9. Kohler Group
8.3.10. Roca Sanitario SA
8.3.11. Inax , Duravit AG
8.3.12. Kita-Kyushu
8.3.13. RAK Ceramics
8.3.14. Eczacibasi Holding Co.
8.3.15. Ceramica Althea
8.3.16. Villeroy & Boch
8.3.17. Sanitec
8.3.18. Duratex
8.3.19. Corona Group
8.3.20. Cisa Holdings
8.3.21. Ferrum S.A. De Ceramica Y Metalurgia
8.3.22. Hervy Sanitary ware and others.
SDMR employs a three way data triangulation approach to arrive at market estimates. We use primary research, secondary research and data triangulation by top down and bottom up approach
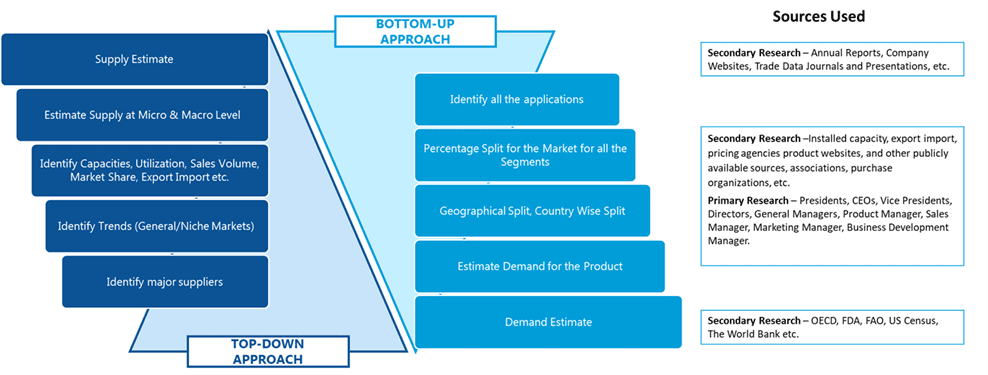
Secondary Research:
Our research methodology involves in-depth desk research using various secondary sources. Data is gathered from association/government publications/databases, company websites, press releases, annual reports/presentations/sec filings, technical papers, journals, research papers, magazines, conferences, tradeshows, and blogs.
Key Data Points through secondary research-
Macro-economic data points
Import Export data
Identification of major market trends across various applications
Primary understanding of the industry for both the regions
Competitors analysis for the production capacities, key production sites, competitive landscape
Key customers
Production Capacity
Pricing Scenario
Cost Margin Analysis
Key Data Points through primary research-
Major factors driving the market and its end application markets
Comparative analysis and customer analysis
Regional presence
Collaborations or tie-ups
Annual Production, and sales
Profit Margins
Average Selling Price
Data Triangulation:
Data triangulation is done using top down and bottom approaches. However, to develop accurate market sizing estimations, both the methodologies are used to accurately arrive at the market size. Insert Image
