The smart transportation market was $ 80 billion in 2018 and anticipated to reach $ 298 billion by the end of 2023 growing at a CAGR of 22.5 % from 2018-2023. The transportation industry of an economy is one of the key contributors towards the country’s gross domestic product (GDP). The key factors such as growing income level, increasing consumer awareness, growing urbanization across the globe, attract this development. However, this growth needs a specific system to create a sustainable growth in the economy in which efficient transportation management plays a key role. The smart transportation management system is a key solution to provide the efficient and effective solution to the overall transport management.
The smart transport system enables various users to be more coordinated, better informed, and make safer and smarter use of transport networks. The management basically includes the services such as automated planning, various parking management & guidance, passenger information, and traffic management etc.
In 2018, European region captured the largest market share in the smart transportation market. The market is mainly driven by the need for better safety and security and integrating intelligent communication systems in the infrastructure, which fuelling its growth, in which in
The increasing modernization in economy expanded the market of various advanced technologies, where transportation management is also creating its path. The increasing market penetration in developing countries such as China and India would also increase the market potential giving boost to the market growth. This trend is expected to continue during the forecast period 2018–2023, to further improve the transportation market.
Some of the prominent players in the smart transportation market are Cisco Systems, Hewlett Packard Enterprise, IBM Corporation, Siemens AG, and General Electric, Accenture PLC. , Symantec Corporation, Xerox Corporation, Garmin Ltd, Thales Group, NEC Corporation, Palo Alto Networks, Inc., Juniper Networks, Inc. and Other
1 Introduction
1.1 Goal & Objective
1.2 Report Coverage
1.3 Supply Side Data Modeling & Methodology
1.4 Demand Side Data Modeling & Methodology
2 Executive Summary
3 Market Outlook
3.1 Introduction
3.2 Current & Future Outlook
3.3 DROC
3.3.1 Drivers
3.3.1.1 Demand Drivers
3.3.1.2 Supply Drivers
3.3.2 Restraints
3.3.3 Opportunities
3.3.4 Challenges
3.4 Market Entry Matrix
3.5 Market Opportunity Analysis
3.6 Market Regulations
3.7 Pricing Mix
3.8 Key Customers
3.9 Value Chain & Ecosystem
4 Market Demand Analysis
4.1 Smart Transportation Market, By Applications
4.1.1 Parking Management Solutions
4.1.2 Ticketing Management Solutions
4.1.3 Traffic Management Solutions
4.1.4 Insurance Telematics Solutions
4.1.4 Others
5 Smart Transportation Market Analysis, By Services
5.1 Introduction
5.2 Hardware
5.3 Software
5.4 Services
5.4.1 Cloud Services
5.4.2 Business Services
5.4.3 Professional Services
6 Smart Transportation Market Analysis, By Transportation Mode
6.1 Introduction
6.2 Railways
6.3 Roadways
7 Smart Transportation Market Analysis, By Region
7.1 North America
7.1.1 USA
7.1.2 Canada
7.1.3 Mexico
7.2 Europe
7.2.1 Germany
7.2.2 Italy
7.2.3 France
7.2.4 UK
7.2.5 Rest of Europe
7.3 Asia Pacific
7.3.1 China
7.3.2 Japan
7.3.3 India
7.3.4 Australia
7.3.5 Singapore
7.3.6 Rest of APAC
7.4 Middle East & Africa
7.4.1 Saudi Arabia
7.4.2 UAE
7.4.3 Rest Of MEA
7.5 South America
7.5.1 Brazil
7.5.2 Argentina
7.5.3 Rest of South America
8 Supply Market Analysis (Industry Player Analysis)
8.1 Strategic Benchmarking
8.2 Market Share Analysis
8.3 Key Players
8.3.1 Cisco Systems
8.3.2 Hewlett Packard Enterprise
8.3.3 IBM Corporation
8.3.4 Siemens AG
8.3.5 General Electric
8.3.6 Accenture PLC.
8.3.7 Symantec Corporation
8.3.8 Xerox Corporation
8.3.9 Garmin Ltd,
8.3.10 Thales Group
8.3.11 NEC Corporation
8.3.12 Palo Alto Networks, Inc.
8.3.13 Juniper Networks, Inc.
8.3.18 Other Players
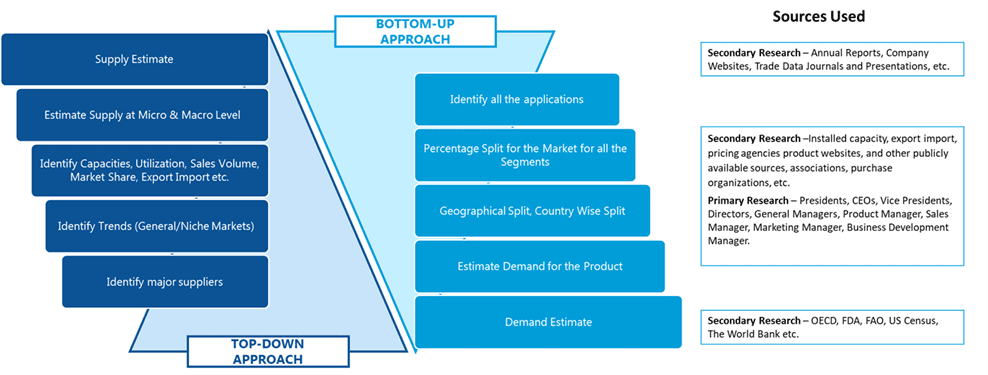
SDMR employs a three way data triangulation approach to arrive at market estimates. We use primary research, secondary research and data triangulation by top down and bottom up approach
Secondary Research:
Our research methodology involves in-depth desk research using various secondary sources. Data is gathered from association/government publications/databases, company websites, press releases, annual reports/presentations/sec filings, technical papers, journals, research papers, magazines, conferences, tradeshows, and blogs.
Key Data Points through secondary research-
Macro-economic data points
Import Export data
Identification of major market trends across various applications
Primary understanding of the industry for both the regions
Competitors analysis for the production capacities, key production sites, competitive landscape
Key customers
Production Capacity
Pricing Scenario
Cost Margin Analysis
Key Data Points through primary research-
Major factors driving the market and its end application markets
Comparative analysis and customer analysis
Regional presence
Collaborations or tie-ups
Annual Production, and sales
Profit Margins
Average Selling Price
Data Triangulation:
Data triangulation is done using top down and bottom approaches. However, to develop accurate market sizing estimations, both the methodologies are used to accurately arrive at the market size. Insert Image
