The total district cooling market is valued at $ 5.6 billion as on 2018 and is likely to reach $ 10.23 billion by the end of 2023, growing at a CAGR of 14.1%. The district cooling market is will bolstered as it offers various benefits such as it helps in capital cost savings by 8%, around 50% reduction of electric power consumption and reduction of CO2 and refrigerant emissions by 60-70% and good operational efficiency as compared to other cooling technologies when it used in highly dense areas.
The factors driving the district cooling market are energy efficient cooling technology. Recently, United Nations has considered district cooling as the most energy efficient technology as it aids in preserving energy and water. The major issues faced in this market are risk of early investments, and initial high capital costs.
In 2018, the district cooling market is dominated by Middle East & Africa market followed by North America and then Asia-Pacific. The Middle East will experience the highest growth rate during the forecast period as district cooling offers various advantages such as high cooling density, more cost efficient than conventional cooling, more energy efficient, no harmful impact on the environment. By 2030, if district cooling is properly employed, then it can fulfill 30% cooling needs of GCC countries.
The district cooling market has been segmented on the applications i.e. residential, commercial and industrial. In 2018, the residential segment will experience high growth in the next five years where as commercial segment will account for the highest growth rate. The commercial segment will experience the highest growth rate due to increasing demand of district cooling in hotels, molls etc.
The growth in district cooling market is influenced by investments and major expansion plans. In 2018, UAE based National Central Cooling Company (Tabreed) and the Masdar Institute of Science and Technology, completed three years R& D project in district cooling plant. Some of the prominent players in the market are Empower, National Central Cooling Company PJSC (Tabreed), Semens AG, District Cooling Company LLC, Qatar Coolol, Danfoss District Energy A/S, ADC ENERGY SYSTEMS LLC, Keppeldchs PTE Ltd, Marafeq Qatar, Logstor.
1 Introduction
1.1 Goal & Objective
1.2 Report Coverage
1.3 Supply Side Data Modelling & Methodology
1.4 Demand Side Data Modelling & Methodology
2 Executive Summary
3 Market Outlook
3.1 Introduction
3.2 Current & Future Outlook
3.3 DROC
3.3.1 Drivers
3.3.2 Restraints
3.3.3 Opportunities
3.3.4 Challenges
3.4 Market Entry Matrix
3.5 Market Opportunity Analysis
3.6 Market Regulations
3.7 Pricing Mix
3.8 Key Customers
3.9 Value Chain & Ecosystem
4 Demand Market Analysis
4.1 District Cooling Market, By Application
4.1.1 Residential
4.1.1.1 Market Size & Forecasts, 2018-2023
4.1.2 Commercial
4.1.2.1 Market Size & Forecasts, 2018-2023
4.1.3 Industrial
4.1.3.1 Market Size & Forecasts, 2018-2023
5 District Cooling Market, By Technique
5.1 Introduction
5.2 Free Cooling
5.2.1 Market Size & Forecasts, 2018-2023
5.3 Electric Chiller
5.3.1 Market Size & Forecasts, 2018-2023
5.4 Absorption Cooling
5.4.1 Market Size & Forecasts, 2018-2023
5.5 Others
5.5.1 Market Size & Forecasts, 2018-2023
6 District Cooling Market Projects, By Region
6.1 Introduction
6.2 North America
6.3 Europe
6.4 Asia-Pacific
6.5 Middle East & Africa
6.6 South America
7 District Cooling Market Analysis, By Region
7.1 North America
North America Market Size, By Country 2018-2023
North America Market Size, By Technique 2018-2023
North America Market Size, By Application 2018-20223
U.S.
U.S. Market Size, By Technique 2018-2023
U.S. Market Size, By Application 2018-2023
Canada
Canada Market Size, By Technique 2018-2023
Canada Market Size, By Application 2018-2023
Mexico
Mexico Market Size, By Technique 2018-2023
Mexico Market Size, By Application 2018-2023
7.2 Europe
Europe Market Size, By Country 2018-2023
Europe Market Size, By Technique 2018-2023
Europe Market Size, By Application 2018-20223
Germany
Germany Market Size, By Technique 2018-2023
Germany Market Size, By Application 2018-2023
Italy
Italy Market Size, By Technique 2018-2023
Italy Market Size, By Application 2018-2023
France
France Market Size, By Technique 2018-2023
France Market Size, By Application 2018-2023
UK
UK Market Size, By Technique 2018-2023
UK Market Size, By Application 2018-2023
Rest of Europe
Rest Of Europe Market Size, By Technique Type 2018-2023
Rest Of Europe Market Size, By Application 2018-2023
7.3 Asia-Pacific
Asia-Pacific Market Size, By Country 2018-2023
Asia-Pacific Market Size, By Technique 2018-2023
Asia-Pacific Market Size, By Application 2018-2023
China
China Market Size, By Technique 2018-2023
Asia-Pacific Market Size, By Application 2018-20223
India
India Market Size, By Technique 2018-2023
India Market Size, By Application 2018-2023
Japan
Japan Market Size, By Technique 2018-2023
Japan Market Size, By Application 2018-2023
Australia
Australia Market Size, By Technique 2018-2023
Australia Market Size, By Application 2018-2023
Rest of APAC
Rest Of APAC Market Size, By Technique 2018-2023
Rest of APACMarket Size, By Application 2018-20223
7.4 Middle East & Africa
Middle East & Africa Market Size, By Country 2018-2023
Middle East & Africa Market Size, By Technique 2018-2023
Middle East & Africa Market Size, By Application 2018-2023
Saudi Arabia
Saudi Arabia Market Size, By Technique 2018-2023
Saudi Arabia Market Size, By Application 2018-2023
UAE
UAE Market Size, By Technique 2018-2023
UAE Market Size, By Application 2018-2023
Rest Of Middle East & Africa
Rest of Middle East & Africa Market Size, By Technique 2018-2023
Rest of Middle East & Africa Market Size, By Application 2018-2023
7.5 South America
South America Market Size, By Country 2018-2023
South America Market Size, By Technique 2018-2023
South America Market Size, By Application 2018-2023
Brazil
Brazil Market Size, By Technique 2018-2023
Brazil Market Size, By Application 2018-2023
Argentina
Argentina Market Size, By Technique 2018-2023
Argentina Market Size, By Application 2018-2023
Rest of South America
Rest of South America Market Size, By Technique 2018-2023
Rest of South America Market Size, By Application 2018-2023
8 Supply Market Analysis
8.1 Strategic Benchmarking
8.2 Market Share Analysis
8.3 Key Players
8.3.1 Empower
8.3.2 National Central Cooling Company PJSC (Tabreed)
8.3.3 Siemens AG
8.3.4 District Cooling Company LLC
8.3.5 Qatar Coolol
8.3.6 Danfoss District Energy A/S
8.3.7 Logstor
8.3.8 Keppeldchs PTE Ltd
8.3.9 ADC ENERGY SYSTEMS LLC
8.3.10 Keppeldchs PTE Ltd
8.3.11 Marafeq Qatar & Others
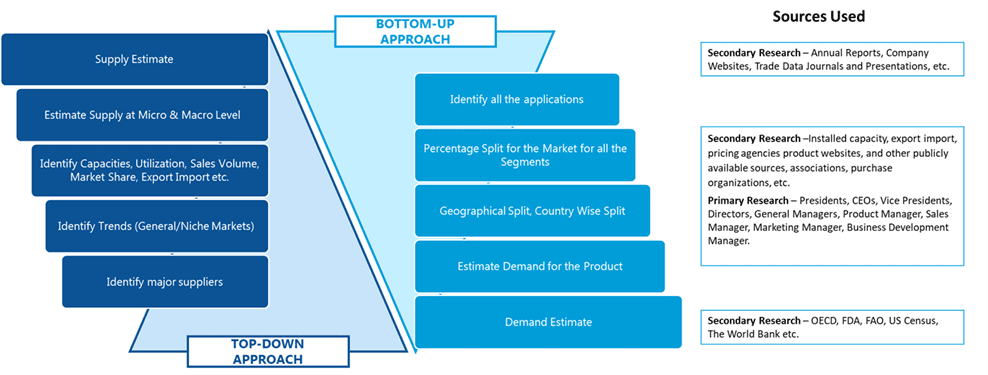
SDMR employs a three way data triangulation approach to arrive at market estimates. We use primary research, secondary research and data triangulation by top down and bottom up approach
Secondary Research:
Our research methodology involves in-depth desk research using various secondary sources. Data is gathered from association/government publications/databases, company websites, press releases, annual reports/presentations/sec filings, technical papers, journals, research papers, magazines, conferences, tradeshows, and blogs.
Key Data Points through secondary research-
Macro-economic data points
Import Export data
Identification of major market trends across various applications
Primary understanding of the industry for both the regions
Competitors analysis for the production capacities, key production sites, competitive landscape
Key customers
Production Capacity
Pricing Scenario
Cost Margin Analysis
Key Data Points through primary research-
Major factors driving the market and its end application markets
Comparative analysis and customer analysis
Regional presence
Collaborations or tie-ups
Annual Production, and sales
Profit Margins
Average Selling Price
Data Triangulation:
Data triangulation is done using top down and bottom approaches. However, to develop accurate market sizing estimations, both the methodologies are used to accurately arrive at the market size. Insert Image
