The organic pigment is anticipated to reach $ 6.0 billion by 2013 growing at a CAGR of 2023. The factors driving the organic pigments market are growing demand from end user industries such as printing inks, plastics, paints & coatings, and leather applications. Some of the factors favoring the market growth are their properties and aesthetics provide intense and bright colors which makes them favorable for printing inks and coatings.
Organic pigments are mainly divided in to natural organic pigments (derived from animal products and plant products) and synthetic organic pigments (made from petroleum compounds). Recently, natural organic pigments have been replaced by the synthetic organic pigments.
The various types of organic pigments covered are Azo Pigments, Phthalocyanine Pigments, and High-performance Pigments (Organic high performance pigments and Metallic Pigments). The high performance pigments will experience the highest grow at a CAGR of 4.0% from 2018-2023 mainly due to environmentally favorable characteristics which makes them suitable for various applications.
The various applications of organic pigments are Inks ( polyamide, vinyl), plastics (PVC,LDPE, HDPE, PP, EVA / Rubber), coatings, (solvent-borne & waterborne decorative coatings, automotive OEM, powder, general industrial, coil coating and others), textile, leather and others. The coating application captured the largest share in 2017 mainly due to increasing demand from automotive and decorative coatings.
The major players in this market are Sun Chemical, JECO Pigments, Hangzhou Baihe Chemical Co., Ltd., China North America Chemical Company Shanghai Silian Industry General Corporation, Changsu City Chemical Plant Company, Dongtai City Pigment Chemical Plant, Akshar Silica Private Limited, Heubach Colour Pvt. Ltd., Meghmani, Parikh Enterprises Pvt. Ltd, Parshwnath Pigments Ltd, Pawan Interchem Industries, Pidilite Industries, Sudarshan Chemicals and others.
1 Introduction
1.1 Goal & Objective
1.2 Report Coverage
1.3 Supply Side Data Modelling & Methodology
1.4 Demand Side Data Modelling & Methodology
2 Executive Summary
3 Market Outlook
3.1 Introduction
3.2 Current & Future Outlook
3.3 DROC
3.3.1 Drivers
3.3.1.1 Demand Drivers
3.3.1.2 Supply Drivers
3.3.2 Restraints
3.3.3 Opportunities
3.3.4 Challenges
3.4 Installed Capacity
3.5 Production
3.6 Imports
3.7 Exports
3.8 Key Customers
3.9 Value Chain & Ecosystem
3.1 Manufacturing Cost Analysis
3.10.1 Production Process Details
3.10.1.1 Process Flow Diagram
3.10.1.2 Chemixcal Reactions
3.10.1.3 Material Balance
3.10.1.4 Energy Balance
3.10.2 Production Cost Analysis
3.10.2.1 Raw Material Cost
3.10.2.1.1 Carbazole
3.10.2.1.2 Mono Chloro Benzene
3.10.2.1.3 Caustic Soda Lye
3.10.2.1.4 Di Ethyl Sulphate
3.10.2.1.5 Dilute Nitric Acid
3.10.2.1.6 Ortho Di Chloro Benzene
3.10.2.1.7 Sodium Acetate
3.10.2.1.8 Benzene Sulphonyl Chloride
3.10.2.1.9 Others
3.10.3 Utilities
3.10.4 Fixed Costs
3.10.5 Cost of Production
4 Organic Pigments Market, By Application
4.1 Inks
4.1.1 Polyamide
4.1.2 Vinyl
4.2 Plastics
4.2.1 PVC
4.2.2 LDPE
4.2.3 HDPE
4.2.4 PP
4.2.5 EVA / Rubber
4.3 Coatings
4.3.1 Solvent-borne & Waterborne Decorative Coatings
4.3.2 Automotive OEM
4.3.3 Powder
4.3.4 General Industrial
4.3.5 Coil Coating
4.3.6 Others
4.4 Textile Industry
4.5 Leather Industry
4.6 Others
5 Organic Pigments Market, By Type
5.1 Azo Pigments
5.2 Phthalocyanine Pigments
5.3 High Performance Pigments
5.3.1 Organic Pigments
5.3.2 Metallic Pigments
6 Organic Pigments Market Analysis, By Region
6.1 Natural Pigments
6.2 Synthetic Pigments
7 Organic Pigments Market Analysis, By Region
7.1 North America
U.S.
Canada
Mexico
7.2 Western Europe
Austria
Belgium
Netherlands
France
Germany
Britain
Italy
Denmark
Finland
Norway
Sweden
Spain
Portugal
7.3 Central and Eastern Europe
Hungary
Czech Republic
Slovakia
Turkey
Belarus
Ukraine
Bulgaria
Croatia
Romania
7.4 Asia-Pacific
China
Japan
India
South Korea
Taiwan
Vietnam
Indonesia
Malaysia
Thailand
Philippines
Singapore
Rest of the world
7.5 Middle East & Africa Middle East
Saudi Arabia
UAE
Others
7.6 Africa Africa
South Africa
Uganda
Botswana
Others
8 Supply Market Analysis (Industrial Player Analysis)
8.1 Strategic Benchmarking
8.2 Market Share Analysis
8.3 Key Players
8.3.1 Overview
8.3.2 Financials
8.3.3 Installed Capacity
8.3.1 Key products
8.3.2 Pigments
8.3.3 Pigment Violet 23
8.3.4 Capacity Expansion Plans
8.3.4 Tentative List of key players
8.3.4.1 Sun Chemical
8.3.4.2 JECO Pigments
8.3.4.3 Jiangsu Multicolor Fine Chemical Industry Company Limited
8.3.4.4 Jiangsu Wucai Fine Chemical Company Limited
8.3.4.5 Yixing City Yonggu Chemical Factory
8.3.4.6 Linhai City Best Fine Pigment Chemical Company Limited
8.3.4.7 Anhui Heya Fine Chemical Company Limited
8.3.4.8 Nangtong Longteng Chemical Company Limited
8.3.4.9 Hangzhou Shine Chemicals Company Limited
8.3.4.10 Hangzhou Baihe Chemical Co., Ltd.
8.3.4.11 China North America Chemical Company
8.3.4.12 Gharda
8.3.4.13 Heubach Colour Pvt. Ltd.
8.3.4.14 Meghmani
8.3.4.15 Parikh Enterprises Pvt. Ltd
8.3.4.16 Parshwnath Pigments Ltd
8.3.4.17 Pawan Interchem Industries
8.3.4.18 Pidilite Industries
8.3.4.19 Sudarshan Chemicals & Others
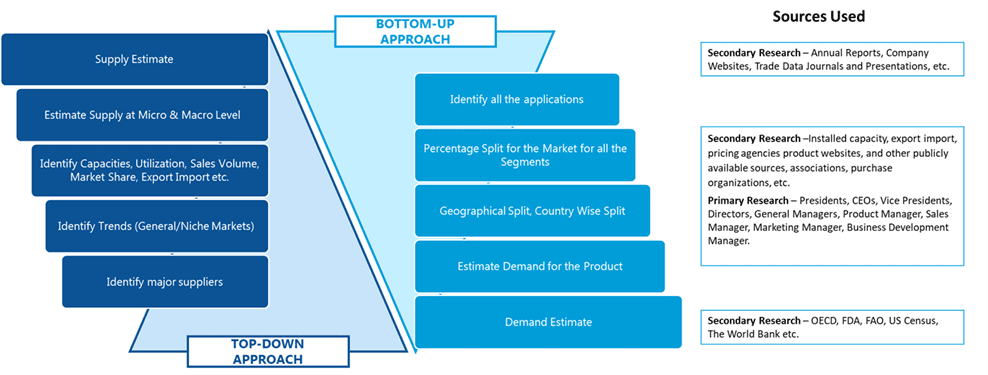
SDMR employs a three way data triangulation approach to arrive at market estimates. We use primary research, secondary research and data triangulation by top down and bottom up approach
Secondary Research:
Our research methodology involves in-depth desk research using various secondary sources. Data is gathered from association/government publications/databases, company websites, press releases, annual reports/presentations/sec filings, technical papers, journals, research papers, magazines, conferences, tradeshows, and blogs.
Key Data Points through secondary research-
Macro-economic data points
Import Export data
Identification of major market trends across various applications
Primary understanding of the industry for both the regions
Competitors analysis for the production capacities, key production sites, competitive landscape
Key customers
Production Capacity
Pricing Scenario
Cost Margin Analysis
Key Data Points through primary research-
Major factors driving the market and its end application markets
Comparative analysis and customer analysis
Regional presence
Collaborations or tie-ups
Annual Production, and sales
Profit Margins
Average Selling Price
Data Triangulation:
Data triangulation is done using top down and bottom approaches. However, to develop accurate market sizing estimations, both the methodologies are used to accurately arrive at the market size. Insert Image
