The high temperature insulation materials market is estimated to account for $ 4.0 billion in 2017, and is projected to grow at a CAGR of 7.5% to reach $ 6.1 billion by 2023. The major driving factor for HTI materials market have been the rising awareness and emphasis on use of energy efficient products owing to stringent regulations in place to reduce the GHG emissions. The major restraint observed in the HTI market is the carcinogenic nature of insulation material which is found to pose risks to human health. Therefore, stringent regulations have been in place to guide the production process, primarily in the North American and European markets. The opportunities for players in the HTI market lies in exploring the novel applications in the segments such as aerospace, automotive, renewable, and fire protection alongside devolvement of bio-based insulation materials. With respect to high temperature insulation materials types, Ceramic fiber is the largest segment. The superior properties of ceramic fibers, such as low thermal conductivity, high strength, and lightweight, and wide range of operating temperatures has been driving the ceramic fibers’ demand over the years.
The ceramic fibers segment is estimated to account for $ 2.0 billion in 2017 and is projected to grow at a CAGR of 5.0% between 2018 and 2023.
Calcium silicate, another HTI material is expected to witness the highest CAGR of 6.0% over the forecast period. The demand for insulation on industrial grade piping and equipment is increasing across most of the developing economies. Moreover, rise in drilling activities in the petroleum segment globally has fueled the demand for high temperature insulation materials.
The temperature range of 600°C-1100°C has the most widespread products thus accounts for the largest segment among all temperature ranges. This is owing to the maximum use of HTI materials (such as ceramic fibers, insulating firebricks) in the temperature range of 600°C-1100°C.
In terms of market value and volume, Asia-Pacific is the largest segment for high temperature insulation materials market. Emerging economies are the driving force of the HTI industry in this subcontinent. The emerging economies such as China and India offers a bunch of favorable factors such as low labor cost, high growth potential of the end-use industries, and gradual increase in manufacturing establishments. Cumulatively all these factors drive the high temperature insulation materials market in the Asia-Pacific region.
Among all the end-use industries for high temperature insulation materials market, petrochemical is the most significant and the largest segment both in terms of volume and revenue. The growing demand for petrochemical products worldwide has augmented the manufacturers and producers to enhance their production capabilities thus contributing to increased demand for HTI materials. The HTI market in the petrochemicals segment is estimated to account for about 40.0% in 2017 and is expected to grow over 5.0% in the next five years. Insert Image
Ceramics industry is expected to grow at the highest CAGR of over 7.0% over the projected period. This is due to rising trend of ceramic fibers replacing asbestos lining in furnaces and kilns, thus propelling the HTI materials demand. HTI is also gaining popularity among the powder metallurgy manufacturers. Also, industries such as aerospace, solar equipment, and fire protection industries are also expected to augment the demand for HTI over the forecast period.
Asia-Pacific is estimated to account for 45.0% of the high temperature insulation materials market in 2017. It is projected to witness a growth of over 8.0% during the period of 2018-2023. Asia-Pacific is the hub of exports to the North American and the European markets. Isolite Insulating Products Co. Ltd and Luyang Energy-Saving Materials Co., Ltd. and Ibiden are the significant players in the region with a stronghold and diversified portfolio in the APAC market. However, in the North America and Europe markets high emphasis is laid on innovation and investments in research & development. This is due to the fact that stringent governmental regulations emphasize on energy efficient products. 3M, Unifrax, and Morgon Thermal Ceramics are the key players operating in the North America and European markets. The regional markets of North America and Europe have reached saturation and are expected to grow at a moderate CAGR of 3-4%.
The high temperature insulation materials market is highly fragmented and competitive in nature. A large number of multinational corporations and small players operate in this segment through manufacturing and development of diversified products. Quality, price, production capabilities and continuous innovation are the main pillars driving the competition in the industry. The companies aim for strategic collaborations to expand their global footprint and product portfolio in order to strengthen their market position. The key players operating in this industry are 3M, Isolite, Morgan Thermal Ceramics, Unifrax, Pacor, Pyrotek, Promat, Luyang Energy-Saving Materials Co., Ltd., and Zircar among others.
1. Introduction
1.1. Goal & Objective
1.2. Report Coverage
1.3. Supply Side Data Modelling & Methodology
1.4. Demand Side Data Modelling & Methodology
2. Executive Summary
3. Market Outlook
3.1. Introduction
3.2. Current & Future Outlook
3.3. DROC
3.3.1. Drivers
3.3.1.1. Stringent regulations to reduce GHG emissions
3.3.1.2. Emphasis on adoption of energy efficient measures
3.3.2. Restraints
3.3.2.1. Toxic nature of high temperature insulation materials
3.3.3. Opportunities
3.3.3.1. Emerging applications in fire protection, aerospace and other applications
3.3.3.2. Development of bio-based insulation materials
3.4. Market Entry Matrix
3.5. Market Opportunity Analysis
3.6. Market Regulations
3.7. Pricing Mix
3.8. Key Customers
3.9. Value Chain & Ecosystem
4. Demand Market Analysis
4.1. High Temperature Insulation Materials Market, By Type
4.1.1. Ceramic Fibers
4.1.1.1. Market Size & Forecasts, 2018-2025
4.1.1.2. Refractory Ceramic Fibers
4.1.1.3. Polycrystalline Ceramic Fibers
4.1.1.4. Low Bio-Persistent Ceramic Fibers
4.1.2. Calcium Silicate
4.1.2.1. Market Size & Forecasts, 2018-2025
4.1.2.2. Lightweight Calcium Silicate
4.1.2.3. Dense Calcium Silicate
4.1.2.4. Medium Dense Calcium Silicate
4.1.3. Insulating Firebricks (IFB)
4.1.3.1. Market Size & Forecasts, 2018-2025
4.1.3.2. Acidic Refractory Bricks
4.1.3.3. Basic Refractory Bricks
4.1.3.4. Neutral Refractory Bricks
4.1.4. Others
4.1.4.1. Market Size & Forecasts, 2018-2025
4.1.4.2. Perlite
4.1.4.3. Others (Vermiculate, Microporous)
5. High Temperature Insulation Materials Market, By Temperature Range
5.1. Introduction
5.2. High Temperature Insulation Materials in Temperature Range 600-1,100°C
5.2.1. Market Size & Forecasts, 2018-2025
5.3. High Temperature Insulation Materials in Temperature Range 1100-1500°C
5.3.1. Market Size & Forecasts, 2018-2025
5.4. High Temperature Insulation Materials in Temperature Range 1,500-1,700°C
5.4.1. Market Size & Forecasts, 2018-2025
5.5. High Temperature Insulation Materials in Temperature Range 1,700°C and Above
5.5.1. Market Size & Forecasts, 2018-2025
6. High Temperature Insulation Materials Market, By End-Use Industry
6.1. Introduction
6.2. Petrochemicals
6.2.1. Market Size By Region, 2018-2025
6.3. Aluminium
6.3.1. Market Size By Region, 2018-2025
6.4. Ceramics
6.4.1. Market Size By Region, 2018-2025
6.5. Iron & Steel
6.5.1. Market Size By Region, 2018-2025
6.6. Glass
6.6.1. Market Size By Region, 2018-2025
6.7. Cement
6.7.1. Market Size By Region, 2018-2025
6.8. Refractory
6.8.1. Market Size By Region, 2018-2025
6.9. Others
6.9.1. Market Size By Region, 2018-2025
7. High Temperature Insulation Materials Market Analysis, By Region
7.1. North America
7.1.1. North America Market Size, By Country 2018-2025
7.1.2. North America Market Size, By Type 2018-2025
7.1.3. North America Market Size, By Temperature Range 2018-2025
7.1.4. North America Market Size, By End-Use Industry 2018-2025
7.1.4.1. U.S.
7.1.4.1.1. U.S. Market Size, By Type 2018-2025
7.1.4.1.2. U.S. Market Size, By Temperature Range 2018-2025
7.1.4.1.3. U.S. Market Size, By End-Use Industry 2018-2025
7.1.4.2. Canada
7.1.4.2.1. Canada Market Size, By Type 2018-2025
7.1.4.2.2. Canada Market Size, By Temperature Range 2018-2025
7.1.4.2.3. Canada Market Size, By End-Use Industry 2018-2025
7.1.4.3. Mexico
7.1.4.3.1. Mexico Market Size, By Type 2018-2025
7.1.4.3.2. Mexico Market Size, By Temperature Range 2018-2025
7.1.4.3.3. Mexico Market Size, By End-Use Industry 2018-2025
7.2. Europe
7.2.1. Europe Market Size, By Country 2018-2025
7.2.2. Europe Market Size, By Type 2018-2025
7.2.3. Europe Market Size, By Temperature Range 2018-2025
7.2.4. Europe Market Size, By End-Use Industry 2018-2025
7.2.4.1. Germany
7.2.4.1.1. Germany Market Size, By Type 2018-2025
7.2.4.1.2. Germany Market Size, By Temperature Range 2018-2025
7.2.4.1.3. Germany Market Size, By End-Use Industry 2018-2025
7.2.4.2. Italy
7.2.4.2.1. Italy Market Size, By Type 2018-2025
7.2.4.2.2. Italy Market Size, By Temperature Range 2018-2025
7.2.4.2.3. Italy Market Size, By End-Use Industry 2018-2025
7.2.4.3. U.K.
7.2.4.3.1. U.K. Market Size, By Type 2018-2025
7.2.4.3.2. U.K. Market Size, By Temperature Range 2018-2025
7.2.4.3.3. U.K. Market Size, By End-Use Industry 2018-2025
7.2.4.4. France
7.2.4.4.1. France Market Size, By Type 2018-2025
7.2.4.4.2. France Market Size, By Temperature Range 2018-2025
7.2.4.4.3. France Market Size, By End-Use Industry 2018-2025
7.2.4.5. Spain
7.2.4.5.1. Spain Market Size, By Type 2018-2025
7.2.4.5.2. Spain Market Size, By Temperature Range 2018-2025
7.2.4.5.3. Spain Market Size, By End-Use Industry 2018-2025
7.2.4.6. Russia
7.2.4.6.1. Russia Market Size, By Type 2018-2025
7.2.4.6.2. Russia Market Size, By Temperature Range 2018-2025
7.2.4.6.3. Russia Market Size, By End-Use Industry 2018-2025
7.2.4.7. Rest of Europe
7.2.4.7.1. Rest of Europe Market Size, By Type 2018-2025
7.2.4.7.2. Rest of Europe Market Size, By Temperature Range 2018-2025
7.2.4.7.3. Rest of Europe Market Size, By End-Use Industry 2018-2025
7.3. Asia-Pacific
7.3.1. Asia-Pacific Market Size, By Country 2018-2025
7.3.2. Asia-Pacific Market Size, By Type 2018-2025
7.3.3. Asia-Pacific Market Size, By Temperature Range 2018-2025
7.3.4. Asia-Pacific Market Size, By End-Use Industry 2018-2025
7.3.4.1. China
7.3.4.1.1. China Market Size, By Type 2018-2025
7.3.4.1.2. China Market Size, By Temperature Range 2018-2025
7.3.4.1.3. China Market Size, By End-Use Industry 2018-2025
7.3.4.2. Japan
7.3.4.2.1. Japan Market Size, By Type 2018-2025
7.3.4.2.2. Japan Market Size, By Temperature Range 2018-2025
7.3.4.2.3. Japan Market Size, By End-Use Industry 2018-2025
7.3.4.3. India
7.3.4.3.1. India Market Size, By Type 2018-2025
7.3.4.3.2. India Market Size, By Temperature Range 2018-2025
7.3.4.3.3. India Market Size, By End-Use Industry 2018-2025
7.3.4.4. South Korea
7.3.4.4.1. South Korea Market Size, By Type 2018-2025
7.3.4.4.2. South Korea Market Size, By Temperature Range 2018-2025
7.3.4.4.3. South Korea Market Size, By End-Use Industry 2018-2025
7.3.4.5. Taiwan
7.3.4.5.1. Taiwan Market Size, By Type 2018-2025
7.3.4.5.2. Taiwan Market Size, By Temperature Range 2018-2025
7.3.4.5.3. Taiwan Market Size, By End-Use Industry 2018-2025
7.3.4.6. Thailand
7.3.4.6.1. Thailand Market Size, By Type 2018-2025
7.3.4.6.2. Thailand Market Size, By Temperature Range 2018-2025
7.3.4.6.3. Thailand Market Size, By End-Use Industry 2018-2025
7.3.4.7. Malaysia
7.3.4.7.1. Malaysia Market Size, By Type 2018-2025
7.3.4.7.2. Malaysia Market Size, By Temperature Range 2018-2025
7.3.4.7.3. Malaysia Market Size, By End-Use Industry 2018-2025
7.3.4.8. Indonesia
7.3.4.8.1. Indonesia Market Size, By Type 2018-2025
7.3.4.8.2. Indonesia Market Size, By Temperature Range 2018-2025
7.3.4.8.3. Indonesia Market Size, By End-Use Industry 2018-2025
7.3.4.9. Australia
7.3.4.9.1. Australia Market Size, By Type 2018-2025
7.3.4.9.2. Australia Market Size, By Temperature Range 2018-2025
7.3.4.9.3. Australia Market Size, By End-Use Industry 2018-2025
7.3.4.10. Rest of Asia-Pacific
7.3.4.10.1. Rest of Asia-Pacific Market Size, By Type 2018-2025
7.3.4.10.2. Rest of Asia-Pacific Market Size, By Temperature Range 2018-2025
7.3.4.10.3. Rest of Asia-Pacific Market Size, By End-Use Industry 2018-2025
7.4. Middle East & Africa
7.4.1. Middle East & Africa Market Size, By Country 2018-2025
7.4.2. Middle East & Africa Market Size, By Type 2018-2025
7.4.3. Middle East & Africa Market Size, By Temperature Range 2018-2025
7.4.3.1. Saudi Arabia
7.4.3.1.1. Saudi Arabia Market Size, By Type 2018-2025
7.4.3.1.2. Saudi Arabia Market Size, By Temperature Range 2018-2025
7.4.3.1.3. Saudi Arabia Market Size, By End-Use Industry 2018-2025
7.4.3.2. UAE
7.4.3.2.1. UAE Market Size, By Type 2018-2025
7.4.3.2.2. UAE Market Size, By Temperature Range 2018-2025
7.4.3.2.3. UAE Market Size, By End-Use Industry 2018-2025
7.4.3.3. Turkey
7.4.3.3.1. Turkey Market Size, By Type 2018-2025
7.4.3.3.2. Turkey Market Size, By Temperature Range 2018-2025
7.4.3.3.3. Turkey Market Size, By End-Use Industry 2018-2025
7.4.3.4. Rest Of Middle East & Africa
7.4.3.4.1. Rest Of Middle East & Africa Market Size, By Type 2018-2025
7.4.3.4.2. Rest Of Middle East & Africa Market Size, By Temperature Range 2018-2025
7.4.3.4.3. Rest Of Middle East & Africa Market Size, By End-Use Industry 2018-2025
7.5. South America
7.5.1. South America Market Size, By Country 2018-2025
7.5.2. South America Market Size, By Type 2018-2025
7.5.3. South America Market Size, By Temperature Range 2018-2025
7.5.4. South America Market Size, By End-Use Industry 2018-2025
7.5.4.1. Brazil
7.5.4.1.1. Brazil Market Size, By Type 2018-2025
7.5.4.1.2. Brazil Market Size, By Temperature Range 2018-2025
7.5.4.1.3. Brazil Market Size, By End-Use Industry 2018-2025
7.5.4.2. Argentina
7.5.4.2.1. Argentina Market Size, By Type 2018-2025
7.5.4.2.2. Argentina Market Size, By Temperature Range 2018-2025
7.5.4.2.3. Argentina Market Size, By End-Use Industry 2018-2025
7.5.4.3. Rest of South America
7.5.4.3.1. Rest of South America Market Size, By Type 2018-2025
7.5.4.3.2. Rest of South America Market Size, By Temperature Range 2018-2025
7.5.4.3.3. Rest of South America Market Size, By End-Use Industry 2018-2025
8. Supply Market Analysis
8.1. Strategic Benchmarking
8.2. Market Share Analysis
8.3. Key Players
8.3.1. 3M Company
8.3.2. Isolite Insulating Products Co. Ltd.
8.3.3. Morgan Thermal Ceramics
8.3.4. Luyang Energy-Saving Materials Co., Ltd.
8.3.5. Dyson Group PLC
8.3.6. Unifrax LLC
8.3.7. Pacor Inc.
8.3.8. Promat International NV
8.3.9. Pyrotek
8.3.10. Mitsubishi Plastics Inc.
8.3.11. RHI AG
8.3.12. Etex Group
8.3.13. Almatis GmbH
8.3.14. Zircar
8.3.15. ADL Insulflex Inc & Others
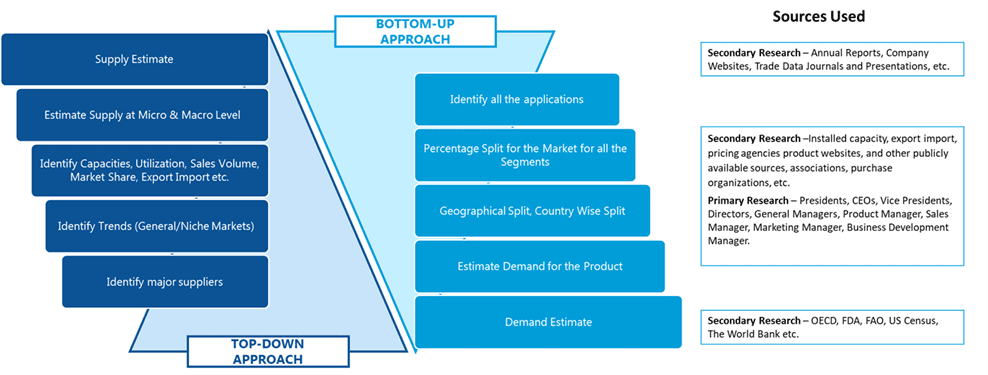
SDMR employs a three way data triangulation approach to arrive at market estimates. We use primary research, secondary research and data triangulation by top down and bottom up approach
Secondary Research:
Our research methodology involves in-depth desk research using various secondary sources. Data is gathered from association/government publications/databases, company websites, press releases, annual reports/presentations/sec filings, technical papers, journals, research papers, magazines, conferences, tradeshows, and blogs.
Key Data Points through secondary research-
Macro-economic data points
Import Export data
Identification of major market trends across various applications
Primary understanding of the industry for both the regions
Competitors analysis for the production capacities, key production sites, competitive landscape
Key customers
Production Capacity
Pricing Scenario
Cost Margin Analysis
Key Data Points through primary research-
Major factors driving the market and its end application markets
Comparative analysis and customer analysis
Regional presence
Collaborations or tie-ups
Annual Production, and sales
Profit Margins
Average Selling Price
Data Triangulation:
Data triangulation is done using top down and bottom approaches. However, to develop accurate market sizing estimations, both the methodologies are used to accurately arrive at the market size. Insert Image
