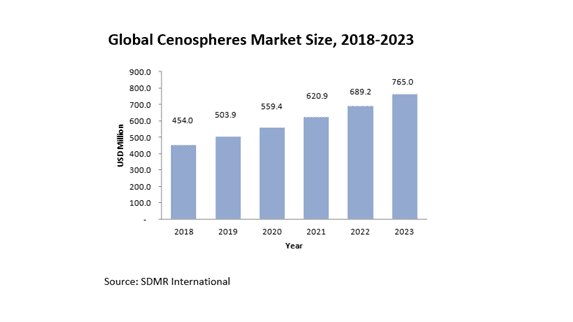
The cenospheres market is estimated to account for USD 409.0 million in 2017, and is projected to grow at a CAGR of 11.0% to reach USD 765.0 million by 2023. Cenospheres market is expected to grow bolstered by growth from end-use industries such as oil & gas, construction, and refractory and superior structural properties. Limited availability of raw material and lack of quality control across emerging countries are the major restraints observed in the cenospheres market. However, the challenge is capital and technological intensive nature of manufacturing process. The opportunities for players in this market lie in exploring methods for reclamation of fly ash lagoons.
The global cenospheres market can be classified into gray cenospheres and white cenospheres based on types. In 2017, gray cenospheres accounts for the largest share and is expected to continue leading the segment during the forecast period. The prime reason for their majority share is their higher abundance in fly ash as compared to white cenospheres. Gray cenospheres are said to posses’ high content of silica & iron and low content of alumina and finds many applications across plastics, coatings, and resins.
The cenospheres market is also analyzed based on density. The cenospheres have been classified as floating cenospheres with density less than 1 gram per cm3, while those greater than 1 gram per cm3 are known as submerged cenospheres. With respect to formulation mode, cenospheres are classified as artificial cenospheres and coal blues cenospheres.
The major end-use industries of cenospheres are oil & gas, refractory, construction, automotive, and paints & coatings, among others. In 2017, Oil & gas is projected to be the fastest-growing end-use industry segment of the market. This is owing to rising demand from increasing drilling operations in oil & gas segment in North America and the Middle East thus driving the demand for microspheres.
In 201, North America accounts for the largest share of the total cenospheres market. Europe and Asia-pacific follows next with second and third rank, respectively. North America cenospheres market is also anticipated to register the highest CAGR during the forecast period. This is owing to the increasing demand from end-use industries such as oil & gas and automotive in the region due to superior characteristics such as low water absorption & thermal conductivity, resistance to acids, ultra-low density, and high particle strength thus improving the properties of finished products. Asia-Pacific cenospheres market is anticipated to register considerable growth during the forecast period due to increasing demand from the emerging economies (such as China, South Korea, and India) owing to technological innovations and strong foothold of the regional players.
Amidst the technological and capital intensive nature of manufacturing process, to manage the costs and maintain the profits is an uphill task for all the players in the cenospheres market. In such a case, potential collaborations and leveraging the resources is the optimum strategy adopted by the market players. The key players in the cenospheres market are Ceno Technologies, Omya AG, Cenosphere India Pvt. Ltd., Durgesh Merchandise Pvt. Ltd., Reslab Microfiller, Cenostar, VIPRA, Scotash Limited, Petra India Group, PR Ecoenergy Pvt. Ltd., Qingdao Eastchem Inc., Envirospheres, and Delamin Limited among others.
1. Introduction
1.1. Goal & Objective
1.2. Report Coverage
1.3. Supply Side Data Modelling & Methodology
1.4. Demand Side Data Modelling & Methodology
2. Executive Summary
3. Market Outlook
3.1. Introduction
3.2. Current & Future Outlook
3.3. DROC
3.3.1. Drivers
3.3.2. Restraints
3.3.3. Opportunities
3.3.4. Challenges
3.4. Market Entry Matrix
3.5. Market Opportunity Analysis
3.6. Market Regulations
3.7. Pricing Mix
3.8. Key Customers
3.9. Value Chain & Ecosystem
4. Demand Market Analysis
4.1. Cenospheres Market, By Type
4.2. White Cenospheres
4.2.1. Market Size & Forecasts, 2018-2025
4.3. Gray Cenospheres
4.3.1. Market Size & Forecasts, 2018-2025
5. Cenospheres Market, by Density
5.1. Floating cenosphere, (<1 g/cm3)
5.1.1. Market Size & Forecasts, 2018-2025
5.2. Submerged cenosphere, (>1 g/cm3, hollow)
5.2.1. Market Size & Forecasts, 2018-2025
6. Cenospheres Market, by Formation Mode
6.1. Artificial cenospheres
6.1.1. Market Size & Forecasts, 2018-2025
6.2. Coal blues cenosphere
6.2.1. Market Size & Forecasts, 2018-2025
7. Cenospheres Market Analysis, By End-Use Industry
7.1. Introduction
7.2. Construction
7.2.1. Market Size By Region, 2018-2025
7.2.1.1. Production Aid
7.2.1.2. Volumetric Filler
7.3. Oil & Gas
7.3.1. Market Size By Region, 2018-2025
7.3.2. Drilling Mud
7.3.3. Well Cementing
7.4. Refractory & Ceramics
7.4.1. Market Size By Region, 2018-2025
7.5. Automotive
7.5.1. Market Size By Region, 2018-2025
7.6. Paints & Coatings
7.6.1. Market Size By Region, 2018-2025
8. Cenospheres Market Analysis, By Region
8.1. North America
8.1.1. North America Market Size, By Country 2018-2025
8.1.2. North America Market Size, By Type 2018-2025
8.1.3. North America Market Size, By End-Use Industry 2018-2025
8.1.3.1. U.S.
8.1.3.1.1. U.S. Market Size, By Type 2018-2025
8.1.3.1.2. U.S. Market Size, By End-Use Industry 2018-2025
8.1.3.2. Canada
8.1.3.2.1. Canada Market Size, By Type 2018-2025
8.1.3.2.2. Canada Market Size, By End-Use Industry 2018-2025
8.1.3.3. Mexico
8.1.3.3.1. Mexico Market Size, By Type 2018-2025
8.1.3.3.2. Mexico Market Size, By End-Use Industry 2018-2025
8.2. Europe
8.2.1. Europe Market Size, By Country 2018-2025
8.2.2. Europe Market Size, By Type 2018-2025
8.2.3. Europe Market Size, By End-Use Industry 2018-2025
8.2.3.1. Germany
8.2.3.1.1. Germany Market Size, By Type 2018-2025
8.2.3.1.2. Germany Market Size, By End-Use Industry 2018-2025
8.2.3.2. Italy
8.2.3.2.1. Italy Market Size, By Type 2018-2025
8.2.3.2.2. Italy Market Size, By End-Use Industry 2018-2025
8.2.3.3. U.K.
8.2.3.3.1. U.K. Market Size, By Type 2018-2025
8.2.3.3.2. U.K. Market Size, By End-Use Industry 2018-2025
8.2.3.4. France
8.2.3.4.1. France Market Size, By Type 2018-2025
8.2.3.4.2. France Market Size, By End-Use Industry 2018-2025
8.2.3.5. Spain
8.2.3.5.1. Spain Market Size, By Type 2018-2025
8.2.3.5.2. Spain Market Size, By End-Use Industry 2018-2025
8.2.3.6. Russia
8.2.3.6.1. Russia Market Size, By Type 2018-2025
8.2.3.6.2. Russia Market Size, By End-Use Industry 2018-2025
8.2.3.7. Poland
8.2.3.7.1. Poland Market Size, By Type 2018-2025
8.2.3.7.2. Poland Market Size, By End-Use Industry 2018-2025
8.2.3.8. Rest of Europe
8.2.3.8.1. Rest of Europe Market Size, By Type 2018-2025
8.2.3.8.2. Rest of Europe Market Size, By End-Use Industry 2018-2025
8.3. Asia-Pacific
8.3.1. Asia-Pacific Market Size, By Country 2018-2025
8.3.2. Asia-Pacific Market Size, By Type 2018-2025
8.3.3. Asia-Pacific Market Size, By End-Use Industry 2018-2025
8.3.3.1. China
8.3.3.1.1. China Market Size, By Type 2018-2025
8.3.3.1.2. China Market Size, By End-Use Industry 2018-2025
8.3.3.2. Japan
8.3.3.2.1. Japan Market Size, By Type 2018-2025
8.3.3.2.2. Japan Market Size, By End-Use Industry 2018-2025
8.3.3.3. India
8.3.3.3.1. India Market Size, By Type 2018-2025
8.3.3.3.2. India Market Size, By End-Use Industry 2018-2025
8.3.3.4. South Korea
8.3.3.4.1. South Korea Market Size, By Type 2018-2025
8.3.3.4.2. South Korea Market Size, By End-Use Industry 2018-2025
8.3.3.5. Taiwan
8.3.3.5.1. Taiwan Market Size, By Type 2018-2025
8.3.3.5.2. Taiwan Market Size, By End-Use Industry 2018-2025
8.3.3.6. Thailand
8.3.3.6.1. Thailand Market Size, By Type 2018-2025
8.3.3.6.2. Thailand Market Size, By End-Use Industry 2018-2025
8.3.3.7. Malaysia
8.3.3.7.1. Malaysia Market Size, By Type 2018-2025
8.3.3.7.2. Malaysia Market Size, By End-Use Industry 2018-2025
8.3.3.8. Rest of Asia-Pacific
8.3.3.8.1. Rest of Asia-Pacific Market Size, By Type 2018-2025
8.3.3.8.2. Rest of Asia-Pacific Market Size, By Density 2018-2025
8.3.3.8.3. Rest of Asia-Pacific Market Size, By End-Use Industry 2018-2025
8.4. Middle East & Africa
8.4.1. Middle East & Africa Market Size, By Country 2018-2025
8.4.2. Middle East & Africa Market Size, By Type 2018-2025
8.4.3. Middle East & Africa Market Size, By End-Use Industry 2018-2025
8.4.3.1. Saudi Arabia
8.4.3.1.1. Saudi Arabia Market Size, By Type 2018-2025
8.4.3.1.2. Saudi Arabia Market Size, By End-Use Industry 2018-2025
8.4.3.2. UAE
8.4.3.2.1. UAE Market Size, By Type 2018-2025
8.4.3.2.2. UAE Market Size, By End-Use Industry 2018-2025
8.4.3.3. Rest Of Middle East & Africa
8.4.3.3.1. Rest Of Middle East & Africa Market Size, By Type 2018-2025
8.4.3.3.2. Rest Of Middle East & Africa Market Size, By End-Use Industry 2018-2025
8.5. South America
8.5.1. South America Market Size, By Country 2018-2025
8.5.2. South America Market Size, By Type 2018-2025
8.5.3. South America Market Size, By End-Use Industry 2018-2025
8.5.3.1. Brazil
8.5.3.1.1. Brazil Market Size, By Type 2018-2025
8.5.3.1.2. Brazil Market Size, By End-Use Industry 2018-2025
8.5.3.2. Argentina
8.5.3.2.1. Argentina Market Size, By Type 2018-2025
8.5.3.2.2. Argentina Market Size, By End-Use Industry 2018-2025
8.5.3.3. Rest of South America
8.5.3.3.1. Rest of South America Market Size, By Type 2018-2025
8.5.3.3.2. Rest of South America Market Size, By End-Use Industry 2018-2025
9. Supply Market Analysis
9.1. Strategic Benchmarking
9.2. Market Share Analysis
9.3. Key Players
9.3.1. Ceno Technologies
9.3.2. Omya AG
9.3.3. Cenosphere India Pvt. Ltd.
9.3.4. Durgesh Merchandise Pvt. Ltd.
9.3.5. Reslab
9.3.6. Cenostar
9.3.7. VIPRA
9.3.8. Scotash Limited
9.3.9. Petra India Group
9.3.10. PR Ecoenergy Pvt. Ltd.
9.3.11. Qingdao Eastchem Inc.
9.3.12. Envirospheres
9.3.13. Delamin Limited
9.3.14. Sidere corp
9.3.15. National Power Engineers & Others
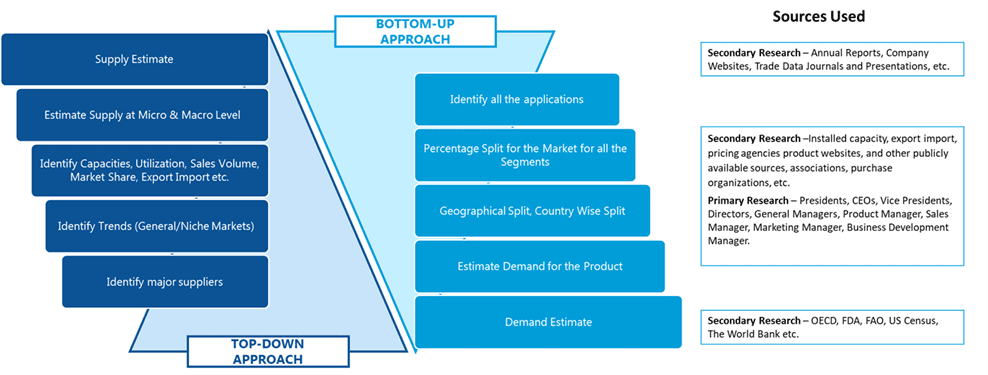
SDMR employs a three way data triangulation approach to arrive at market estimates. We use primary research, secondary research and data triangulation by top down and bottom up approach
Secondary Research:
Our research methodology involves in-depth desk research using various secondary sources. Data is gathered from association/government publications/databases, company websites, press releases, annual reports/presentations/sec filings, technical papers, journals, research papers, magazines, conferences, tradeshows, and blogs.
Key Data Points through secondary research-
Macro-economic data points
Import Export data
Identification of major market trends across various applications
Primary understanding of the industry for both the regions
Competitors analysis for the production capacities, key production sites, competitive landscape
Key customers
Production Capacity
Pricing Scenario
Cost Margin Analysis
Key Data Points through primary research-
Major factors driving the market and its end application markets
Comparative analysis and customer analysis
Regional presence
Collaborations or tie-ups
Annual Production, and sales
Profit Margins
Average Selling Price
Data Triangulation:
Data triangulation is done using top down and bottom approaches. However, to develop accurate market sizing estimations, both the methodologies are used to accurately arrive at the market size. Insert Image
