The total bio-fertilizers market is projected to witness a growth rate of 14.2% from 2017-2023. The market is expected to reach $ 2.8 billion by 2023. Increasing awareness about maintaining soil fertility and adopting environmentally friendly techniques is a major factor behind the bio-fertilizers market growth. There are many benefits associated with bio-fertilizers such as less soil & water contamination, better endurance with seeds & soil, increasing the range of nutrient absorption in soil, etc.
Soil fertility management techniques have received certain importance due to the rising demand for food and the loss of arable land, globally. Severe health impacts as well as contamination of soil, water, and air have been observed due to the use of synthetic or chemical fertilizers. Such hazardous impacts of synthetic fertilizers and the growing demand for food boosts the market growth of bio-fertilizers.
In 2017, Cyanobacteria is the most popular segment in terms of microorganisms, which accounted for the largest market share in the bio-fertilizers market. Cyanobacterial bio-fertilizer harnesses basic natural inputs such as nitrogen, water, and solar energy to ensure as well as enhance soil fertility and plant growth. Phosphate soluble bacteria are expected to witness the fastest growth during the forecast period, due to its need to increase the P2O5 content in soil. By crop type, cereals and grains was observed as the leading segment as it constitutes the basic food elements of people.
In terms of form of bio-fertilizers, liquid formulations that consist of the desired micro form of nutrients, organisms, etc., which promotes the formation of resting spores, was the largest market segment in 2017. Liquid bio-fertilizers are forbearing to UV radiations and high temperature. They have a shelf life of approximately two years, which are applied using fertigation tanks, hand sprays, etc. The liquid bio-fertilizer is projected to witness the highest growth rate during the forecast period due to high enzymatic activity and high acceptance rate amongst consumers.
North America was the largest market for bio-fertilizers in 2017. The growing awareness of consumers regarding harmful health impacts caused due to chemical fertilizers and the growing culture of organic farming drive the market growth in the region. The ban of certain chemicals such as glyphosate, atrazine, chlorpyrifos, 2,4-D, etc., has stimulated the requirement of bio-fertilizers in the region. Asia-Pacific has adopted environmentally friendly techniques of farming. However, a dearth of knowledge and awareness as well as availability of low cost chemical fertilizers limits the usage of bio-fertilizers in several countries of Asia-Pacific.
Companies across the globe are spending extensively on R&D to provide their customers with beneficial bio-fertilizers. Some of the leading manufacturing companies include Biomax, Camson Bio Technologies Limited, Gujarat State Fertilizers & Chemicals Ltd, Lallemand Inc, Madras Fertilizers Limited, Novozymes A/S, National Fertilizers Limited , Nutramax Laboratories, In, Rizobacter Argentina S.A., Rashtriya Chemicals & Fertilizers Ltd., T.Stanes & Company Limited, Agri Life, CBF China Bio-Fertilizer AG, Kiwa Bio-Tech Products Group Corporation, Krishak Bharati Cooperative, & others.
1. Introduction
1.1. Goal & Objectives
1.2. Report Coverage
1.3. Supply Side Data Modelling & Methodology
1.4. Demand Side Data Modelling & Methodology
2. Executive Summary
3. Market Outlook
3.1. Introduction
3.2. Current & Future Outlook
3.3. DROC
3.3.1. Drivers
3.3.1.1. Increasing cost of chemical fertilizers and pesticides
3.3.1.2. Growing awareness and shift towards organic food
3.3.1.3. High losses due to pest attacks
3.3.2. Restraints
3.3.2.1. High demand for Synthetic Fertilizer
3.3.2.2. Low Awareness and Low Adoption Rate
3.3.3. Opportunities
3.3.3.1. Growing demand from Latin America and Asia-Pacific
3.3.4. Challenges
3.4. Market Entry Matrix
3.5. Market Opportunity Analysis
3.6. Market Regulations
3.7. Pricing Mix
3.8. Key Customers
3.9. Value Chain & Ecosystem
4. Demand Market Analysis
4.1. Bio-Fertilizers Market By Type
4.1.1. Nitrogen Fixing
4.1.1.1. Market Size & Forecasts, 2018-2023
4.1.1.2. Azotobacter
4.1.1.3. Rhizobium
4.1.1.4. Azospirillum
4.1.1.5. Others
4.1.2. Phosphate Solubilizing
4.1.2.1. Market Size & Forecasts, 2018-2023
4.1.3. Potash Mobilizing
4.1.3.1. Market Size & Forecasts, 2018-2023
4.1.4. Others
4.1.4.1. Market Size & Forecasts, 2018-2023
5. Bio-Fertilizers Market By Application
5.1.1. Soil Treatment
5.1.1.1. Market Size & Forecasts, 2018-2023
5.1.2. Seed Treatment
5.1.2.1. Market Size & Forecasts, 2018-2023
5.1.3. Others
5.1.3.1. Market Size & Forecasts, 2018-2023
6. Bio-Fertilizers Market, By Microorganism
6.1.1. Azotobacter
6.1.1.1. Market Size & Forecasts, 2018-2023
6.1.2. Azospirillium
6.1.2.1. Market Size & Forecasts, 2018-2023
6.1.3. Rhizobium
6.1.3.1. Market Size & Forecasts, 2018-2023
6.1.4. Phosphate-Soluble bacteria
6.1.4.1. Market Size & Forecasts, 2018-2023
6.1.5. Cyanbacteria
6.1.5.1. Market Size & Forecasts, 2018-2023
6.1.6. Blue-Green Algae
6.1.6.1. Market Size & Forecasts, 2018-2023
6.1.7. Mycorrhiza
6.1.7.1. Market Size & Forecasts, 2018-2023
6.1.8. Others
6.1.8.1. Market Size & Forecasts, 2018-2023
7. Bio-Fertilizers Market By Crop Type
7.1.1. Fruits and Vegetables
7.1.1.1. Market Size & Forecasts, 2018-2023
7.1.2. Cereals & Grains
7.1.2.1. Market Size & Forecasts, 2018-2023
7.1.3. Pulses & Oilseeds
7.1.3.1. Market Size & Forecasts, 2018-2023
7.1.4. Others
7.1.4.1. Market Size & Forecasts, 2018-2023
8. Bio-Fertilizers Market By Form
8.1.1. Liquid Fermentation
8.1.1.1. Market Size & Forecasts, 2018-2023
8.1.2. Dispersible Granules
8.1.2.1. Market Size & Forecasts, 2018-2023
8.1.3. Pellets
8.1.3.1. Market Size & Forecasts, 2018-2023
8.1.4. Powder
8.1.4.1. Market Size & Forecasts, 2018-2023
9. Bio-Fertilizers Market, By Region
9.1.1. North America
9.1.1.1. North America Market Size, By Country 2018-2023
9.1.1.2. North America Market Size, By Product 2018-2023
9.1.1.3. North America Market Size, By Crop Type 2018-2023
9.1.1.4. North America Market Size, By Application 2018-2023
9.1.1.4.1. U.S.
9.1.1.4.1.1. U.S. Market Size, By Product 2018-2023
9.1.1.4.1.2. U.S. Market Size, By Crop Type 2018-2023
9.1.1.4.1.3. U.S. Market Size, By Application 2018-2023
9.1.1.5. Canada
9.1.1.5.1.1. Canada Market Size, By Product 2018-2023
9.1.1.5.1.2. Canada Market Size, By Crop Type 2018-2023
9.1.1.5.1.3. Canada Market Size, By Application 2018-2023
9.1.1.6. Mexico
9.1.1.6.1.1. Mexico Market Size, By Product 2018-2023
9.1.1.6.1.2. Mexico Market Size, By Crop Type 2018-2023
9.1.1.6.1.3. Mexico Market Size, By Application 2018-2023
9.1.2. Europe
9.1.2.1. Europe Market Size, By Country 2018-2023
9.1.2.2. Europe Market Size, By Product 2018-2023
9.1.2.3. Europe Market Size, By Crop Type 2018-2023
9.1.2.4. Europe Market Size, By Application 2018-2023
9.1.2.4.1. Germany
9.1.2.4.1.1. Germany Market Size, By Product 2018-2023
9.1.2.4.1.2. Germany Market Size, By Crop Type 2018-2023
9.1.2.4.1.3. Germany Market Size, By Application 2018-2023
9.1.2.4.2. U.K.
9.1.2.4.2.1. U.K. Market Size, By Product 2018-2023
9.1.2.4.2.2. U.K. Market Size, By Crop Type 2018-2023
9.1.2.4.2.3. U.K. Market Size, By Application 2018-2023
9.1.2.4.3. Italy
9.1.2.4.3.1. Italy Market Size, By Product 2018-2023
9.1.2.4.3.2. Italy Market Size, By Crop Type 2018-2023
9.1.2.4.3.3. Italy Market Size, By Application 2018-2023
9.1.2.4.4. France
9.1.2.4.4.1. France Market Size, By Product 2018-2023
9.1.2.4.4.2. France Market Size, By Crop Type 2018-2023
9.1.2.4.4.3. France Market Size, By Application 2018-2023
9.1.2.4.5. Rest of Europe
9.1.2.4.5.1. Rest of Europe Market Size, By Product 2018-2023
9.1.2.4.5.2. Rest of Europe Market Size, By Crop Type 2018-2023
9.1.2.4.5.3. Rest of Europe Market Size, By Application 2018-2023
9.1.3. Asia-Pacific
9.1.3.1. Asia-Pacific Market Size, By Country 2018-2023
9.1.3.2. Asia-Pacific Market Size, By Product 2018-2023
9.1.3.3. Asia-Pacific Market Size, By Crop Type 2018-2023
9.1.3.4. Asia-Pacific Market Size, By Application 2018-2023
9.1.3.4.1. China
9.1.3.4.1.1. China Market Size, By Product 2018-2023
9.1.3.4.1.2. China Market Size, By Crop Type 2018-2023
9.1.3.4.1.3. China Market Size, By Application 2018-2023
9.1.3.5. India
9.1.3.5.1.1. India Market Size, By Product 2018-2023
9.1.3.5.1.2. India Market Size, By Crop Type 2018-2023
9.1.3.5.1.3. India Market Size, By Application 2018-2023
9.1.3.6. Japan
9.1.3.7. Australia
9.1.3.7.1.1. Australia Market Size, By Product 2018-2023
9.1.3.7.1.2. Australia Market Size, By Crop Type 2018-2023
9.1.3.7.1.3. Australia Market Size, By Application 2018-2023
9.1.3.8. Rest of APAC
9.1.3.8.1.1. Rest of APAC Market Size, By Product 2018-2023
9.1.3.8.1.2. Rest of APAC Market Size, By Crop Type 2018-2023
9.1.3.8.1.3. Rest of APAC Market Size, By Application 2018-2023
9.1.4. South America
9.1.4.1. South America Market Size, By Country 2018-2023
9.1.4.2. South America Market Size, By Product 2018-2023
9.1.4.3. South America Market Size, By Crop Type 2018-2023
9.1.4.4. South America Market Size, By Application 2018-2023
9.1.4.4.1. Brazil
9.1.4.4.1.1. Brazil Market Size, By Product 2018-2023
9.1.4.4.1.2. Brazil Market Size, By Crop Type 2018-2023
9.1.4.4.1.3. Brazil Market Size, By Application 2018-2023
9.1.4.5. Argentina
9.1.4.5.1.1. Argentina Market Size, By Product 2018-2023
9.1.4.5.1.2. Argentina Market Size, By Crop Type 2018-2023
9.1.4.5.1.3. Argentina Market Size, By Application 2018-2023
9.1.4.6. Rest of South America
9.1.4.6.1.1. Rest of South America Market Size, By Product 2018-2023
9.1.4.6.1.2. Rest of South America Market Size, By Crop Type 2018-2023
9.1.4.6.1.3. Rest of South America Market Size, By Application 2018-2023
9.1.5. Middle East & Africa
9.1.5.1. Middle East & Africa Market Size, By Country 2018-2023
9.1.5.2. Middle East & Africa Market Size, By Product 2018-2023
9.1.5.3. Middle East & Africa Market Size, By Crop Type 2018-2023
9.1.5.4. Middle East & Africa Market Size, By Application 2018-2023
9.1.5.4.1. Saudi Arabia
9.1.5.4.1.1. Saudi Arabia Market Size, By Product 2018-2023
9.1.5.4.1.2. Saudi Arabia Market Size, By Crop Type 2018-2023
9.1.5.4.1.3. Saudi Arabia Market Size, By Application 2018-2023
9.1.5.5. UAE
9.1.5.5.1.1. UAE Market Size, By Product 2018-2023
9.1.5.5.1.2. UAE Market Size, By Crop Type 2018-2023
9.1.5.5.1.3. UAE Market Size, By Application 2018-2023
9.1.5.6. Rest of MEA
9.1.5.6.1.1. Rest of MEA Market Size, By Product 2018-2023
9.1.5.6.1.2. Rest of MEA Market Size, By Crop Type 2018-2023
9.1.5.6.1.3. Rest of MEA Market Size, By Application 2018-2023
10. Supply Market Analysis
10.1. Strategic Benchmarking
10.2. Market Share Analysis
10.3. Key Players
10.3.1. Biomax
10.3.2. Camson Bio Technologies Limited
10.3.3. Gujarat State Fertilizers & Chemicals Ltd
10.3.4. Lallemand Inc
10.3.5. Madras Fertilizers Limited
10.3.6. Novozymes A/S
10.3.7. National Fertilizers Limited
10.3.8. Nutramax Laboratories, In
10.3.9. Rizobacter Argentina S.A.
10.3.10. Rashtriya Chemicals & Fertilizers Ltd.
10.3.11. T.Stanes & Company Limited
10.3.12. Agri Life
10.3.13. CBF China Bio-Fertilizer AG
10.3.14. Kiwa Bio-Tech Products Group Corporation
10.3.15. Krishak Bharati Cooperative & Others
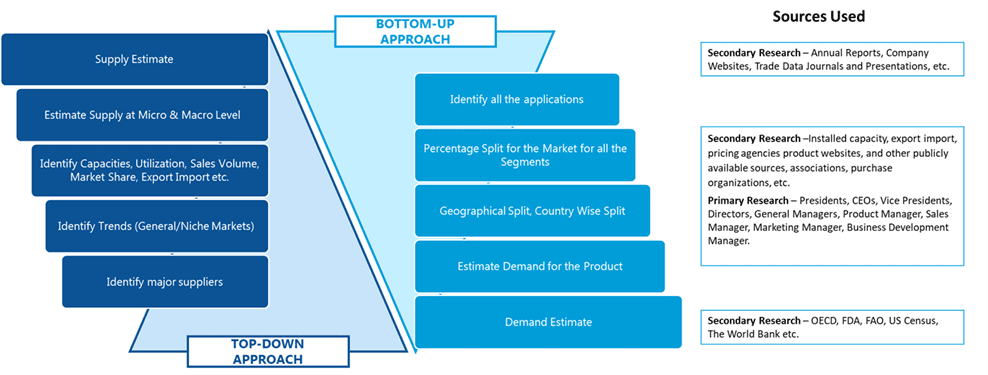
SDMR employs a three way data triangulation approach to arrive at market estimates. We use primary research, secondary research and data triangulation by top down and bottom up approach
Secondary Research:
Our research methodology involves in-depth desk research using various secondary sources. Data is gathered from association/government publications/databases, company websites, press releases, annual reports/presentations/sec filings, technical papers, journals, research papers, magazines, conferences, tradeshows, and blogs.
Key Data Points through secondary research-
Macro-economic data points
Import Export data
Identification of major market trends across various applications
Primary understanding of the industry for both the regions
Competitors analysis for the production capacities, key production sites, competitive landscape
Key customers
Production Capacity
Pricing Scenario
Cost Margin Analysis
Key Data Points through primary research-
Major factors driving the market and its end application markets
Comparative analysis and customer analysis
Regional presence
Collaborations or tie-ups
Annual Production, and sales
Profit Margins
Average Selling Price
Data Triangulation:
Data triangulation is done using top down and bottom approaches. However, to develop accurate market sizing estimations, both the methodologies are used to accurately arrive at the market size. Insert Image
